How to Make a Line Graph in Google Docs (2025 Update)
In this article, we will show you how to make a line graph in Google Docs. Simply follow the steps below!
How to Make a Line Graph on Google Docs
Below, we explain how to create a line graph in Google Docs:
1. Insert a Line Graph
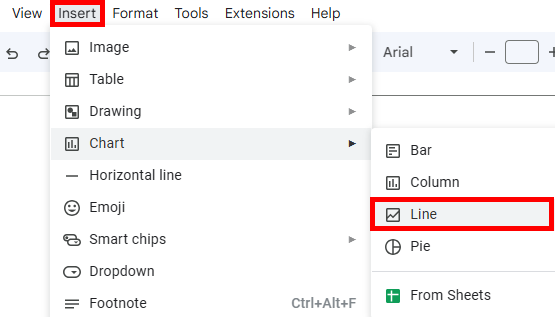
Click on the “Insert” tab. Hover over “Chart”, then select “Line” from the expanded options. This action will automatically generate a line graph.
2. Open the Source for the Line Graph to Edit Your Data
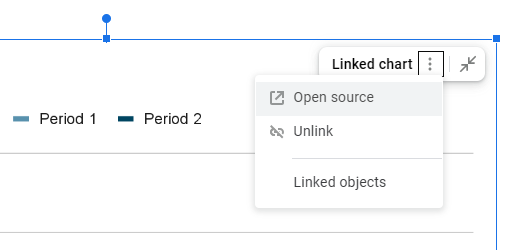
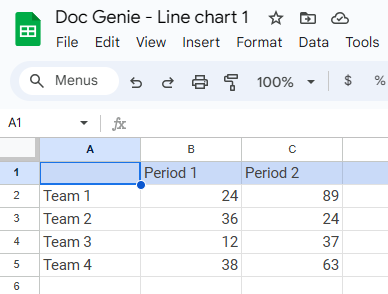
To edit the line graph in Google Docs, click on the three-dot menu (Linked chart options) next to the “Linked chart” label, then select “Open Source.”
You will then be directed to Google Sheets. Here, you can edit your data.
3. Update Your Line Graph
Go back to Google Docs. If you made changes to your chart, click on “Update.”
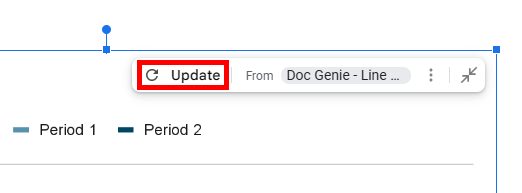
Your line graph should now be updated.
We hope that you now have a better understanding of how to create a line graph in Google Docs. If you enjoyed this article, you might also like our articles on how to insert a thick line in Google Docs and how to remove spaces between lines in Google Docs.